Conductor PDG Scheduler for Houdini
Beta
This feature is currently in BETA. We're interested in hearing your feedback and what improvements we can make. Please direct all feedback to support
This document is a comprehensive reference for the Conductor PDG Scheduler HDA, which seamlessly integrates Houdini PDG graphs with the Conductor render farm. The scheduler offers flexible submission strategies optimized for different workflow requirements.
Table of Contents
Main Tabs
- Overview
- Job Spec Tab
- Actions Row
- General Section
- Render Options
- Advanced Section
- Asset Scan
- Extra Environment
- Miscellaneous
- Preview Tab
- Scheduling Tab
- Submit Each Work Item On a Single Machine
- Work Items Section
- Task Options
- Threading Section
- Execution Tab
- PDG & Scheduling Sub-Tab
- Cook & Parallel Sub-Tab
- Memory & Cache Sub-Tab
- I/O & Network Sub-Tab
- Optimization Tab
- GPU & Rendering Sub-Tab
- Single Machine Sub-Tab
- Profiling & Debug Sub-Tab
- Advanced Sub-Tab
- Best Practices and Cost Control
Overview
Conductor PDG Scheduler
The Conductor PDG Scheduler enables you to submit Houdini PDG (Procedural Dependency Graph) networks directly to the Conductor cloud render farm.
Usage
- Set the Conductor Scheduler as the default scheduler for your TOPnet node
- Configure the scheduler parameters in the HDA interface
- Cook your network by either:
- Selecting the TOPnet node and clicking Cook Output Node, or
- Right-clicking any node in the TOPnet graph and selecting Cook Node
Job Spec Tab
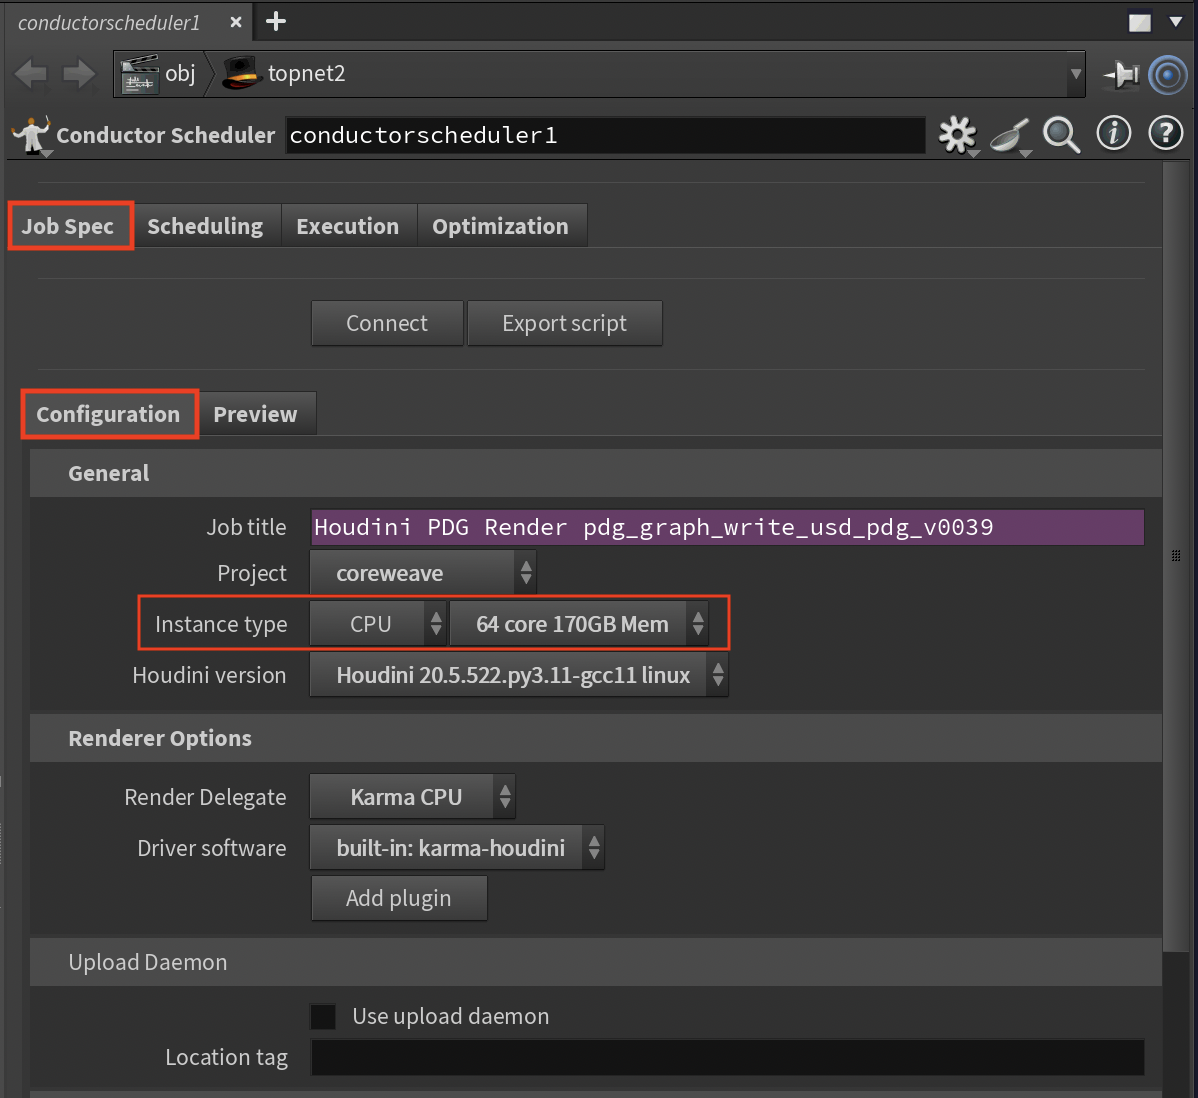
The Job Spec tab contains the core configuration settings for submitting jobs to Conductor.
Actions Row
Connect
Establishes a connection with your Conductor account. This fetches available projects, software packages, and instance types. If settings appear outdated, click Connect again to refresh.
Export Script
Saves a Python script that can submit this job offline, useful for automation and pipeline integration.
General Section
Job Title
The job title that appears in the Conductor dashboard. The default expression evaluates the hipfile name, renderer, and other metadata. Customize this expression to suit your naming conventions.
Project
Select a Conductor project from the dropdown. If only "Not Connected" appears, click the Connect button. Projects help organize jobs and control access within your organization.
Instance Type Family
Choose between CPU-only or GPU-enabled instances. GPU instances are required for GPU-accelerated renderers but are significantly more expensive.
Instance Type
Specify the hardware configuration used to run your tasks. You are encouraged to run tests to find the most cost-efficient combination that meets your deadline. You can read about hardware choices and how they affect costs in this blog post.
Preemptible
Preemptible instances are less expensive to run than non-preemptible. The drawback is that they may be stopped at any time by the cloud provider. The probability of a preemption rises with the duration of the task. Conductor does not support checkpointing, so if a preemption occurs, the task starts from scratch on another instance. It is possible to change the preemptible setting in the dashboard for your account.
Preempted Retries
Number of automatic retry attempts if a preemptible instance is interrupted (typically 2-3 is sufficient).
Houdini Version
The version of Houdini to run on render nodes. Should match your local version for compatibility, though minor version differences are usually acceptable.
Render Options
Render Delegate
Select the renderer(s) to use for the job.
Driver Software
Plugin software that supports the connected input driver (e.g., Solaris, Karma, RenderMan).
Add Plugin
Include additional Conductor-licensed plugins required by your scene.
Upload Daemon
Controls how assets are uploaded to Conductor:
- Off (default): Upload happens within Houdini (simpler but blocks the UI)
- On: Uses a separate daemon process (non-blocking but requires daemon setup)
A better solution may be to turn on Use Upload Daemon. An upload daemon is a separate background process. It means assets are not uploaded in the application. The submission, including the list of expected assets, is sent to Conductor, and the upload daemon continually asks the server if there are assets to upload. When your job hits the server, the upload daemon will get the list and upload them, which allows you to continue with your work.
You can start the upload daemon either before or after you submit the job. Once started, it will listen to your entire account, and you can submit as many jobs as you like.
Note
You must have Conductor Core installed in order to use the upload daemon and other command line tools. See the installation page for options.
To run an upload daemon, open a terminal or command prompt, and run the following command.
conductor uploader
Once started, the upload daemon runs continuously and uploads files for all jobs submitted to your account.
Location Tag
Attach a location to this submission for the purpose of matching to an uploader and/or downloader process.
If your organization is distributed in several locations, you can enter a value here, for example, London. Then when you run a downloader daemon you can add the location option to limit downloads to only those that were submitted in London.
Advanced Section
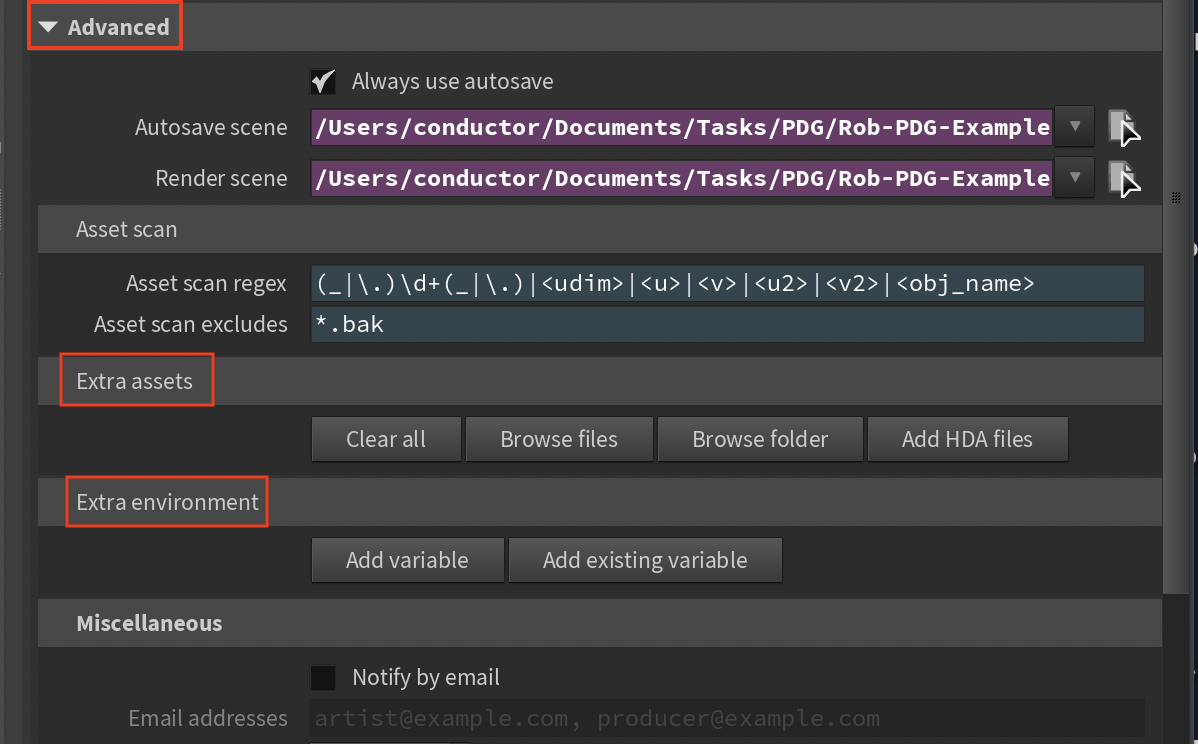
Always Use Autosave
When enabled, the hip file is always saved with the autosave name before submission. When disabled, unmodified scenes use the existing file on disk.
Autosave Scene
Filename pattern for autosaved scenes. Default expression prefixes with cio_.
Render Scene
The hip file path on Linux render nodes. Windows paths are automatically converted (drive letters removed, backslashes to forward slashes).
Asset Scan
Asset Scan Regex
Regular expression pattern used to identify file sequences for upload. Replaces matched components with wildcards to find all sequence files. The default pattern handles common cases like frame numbers and UDIM tiles.
Asset Scan Excludes
Comma-separated Unix-style wildcard patterns to exclude from asset scanning. See Python fnmatch documentation for pattern syntax.
More info
Visit this detailed page for deeper understanding of the asset scraping mechanism.
Extra Assets
Browse for additional files or folders not found by automatic scanning. Check results in the Preview panel with the "Do asset scan" button.
Extra Environment
Add Variable
Define environment variables for render nodes. Useful for custom scripts or tools. For Windows submissions, remember to remove drive letters from paths.
Add Existing Variable
Conveniently add remote environment variables based on local definitions.
Miscellaneous
Notifications
Add one or more email addresses, separated by commas to receive an email when the job completes.
Preview Tab
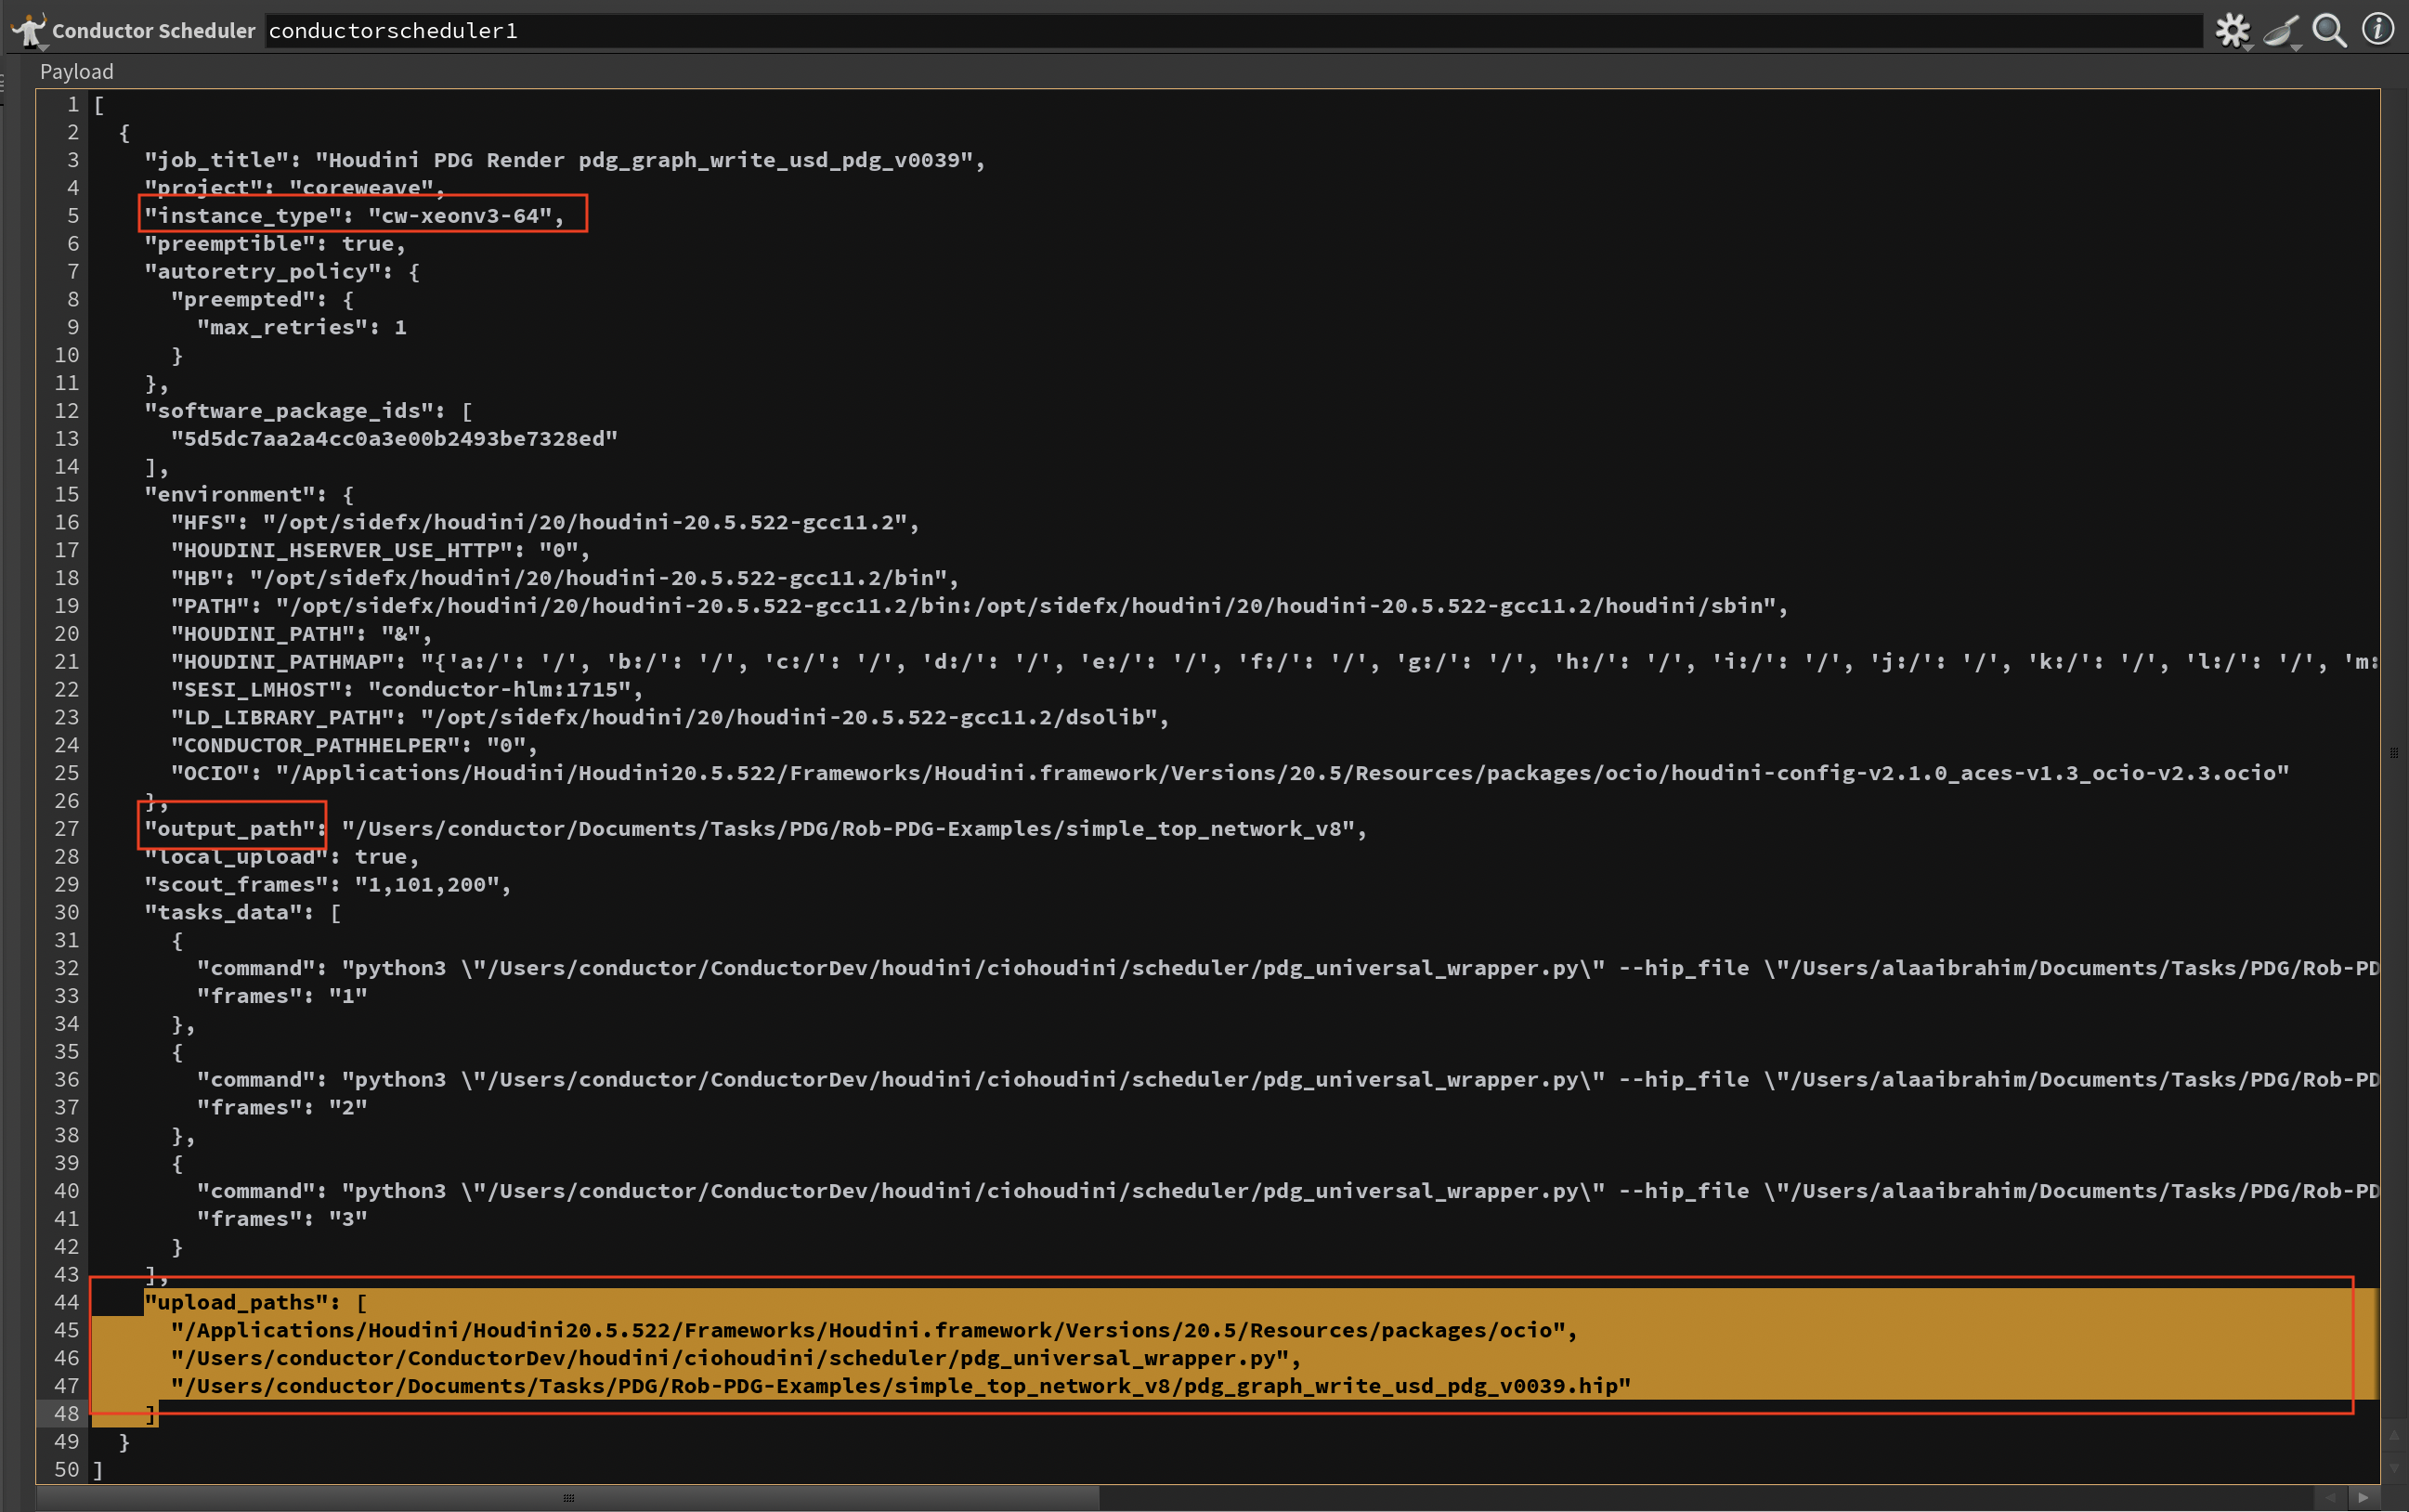
The Preview tab shows the foundational job specification prepared for Conductor submission. This JSON payload represents the base configuration that updates dynamically as you adjust parameters, helping you verify settings and troubleshoot before submission.
Key Features:
- Live Updates: Parameter changes instantly refresh the preview display
- Resolved Expressions: Shows computed values rather than raw Houdini expressions
- Environment Variables: Displays base environment configuration (additional Houdini and PDG-specific variables are added at runtime)
- Task Commands: Shows initial command structure (work-item-specific arguments are injected during execution)
Controls:
Display Tasks
Limits the number of tasks shown in the preview (for display only - doesn't affect submission).
Do Asset Scan
Performs a full asset scan to display all files that will be uploaded. This is compute-intensive so it's manual in the preview, but always runs automatically on submission.
Payload
The raw JSON submission object sent to Conductor. Use this to verify upload paths and environment variables are correct.
Scheduling Tab
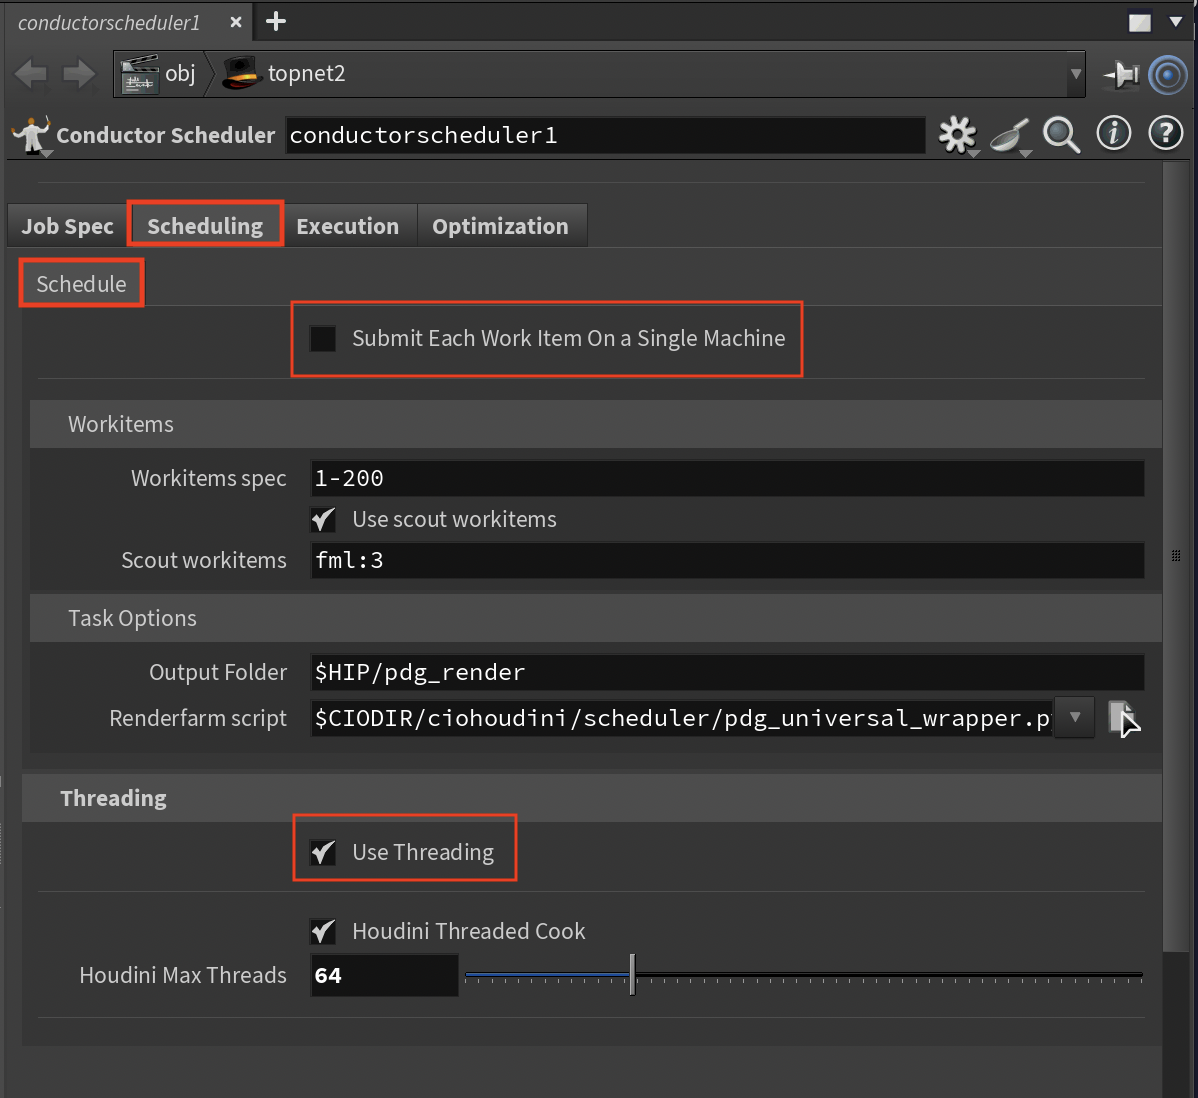
The Scheduling tab controls how PDG graphs are executed on the render farm. The scheduler offers multiple execution methods, each optimized for different network types and scenarios.
Execution Methods
Method 0: Automatic (Try All Methods)
Sequentially tries methods 1-6 until one succeeds, stopping at the first successful method.
Best for: Unknown network types or troubleshooting
Method 1: Network Execution
Generates static work items, then calls cookWorkItems with multiple fallback strategies.
Execution sequence:
- generateStaticWorkItems
- cookWorkItems
- executeGraph on display node
- executeGraph on TOPnet
- Cook button
Best for: Standard PDG networks with straightforward topology
Method 2: PDG Context Cook
Uses PDG graph context directly with 7 fallback strategies.
Execution sequence:
- Dirty then cook
- context.executeGraph
- Async cook with timeout
- graph.cook or graph.execute
- Scheduler cook
- Forced regeneration
- topnet.cookWorkItems fallback
Best for: Complex networks needing fine-grained context control
Method 3: Output Node Cook
Targets the output, display, or render node specifically.
Execution sequence:
- cookWorkItems on output node
- executeGraph on output node
Best for: Networks with clear output nodes and straightforward execution paths
Method 4: Scheduler Execution
Executes via the scheduler with work item generation.
Execution sequence:
- Generate work items for all nodes
- context.cook()
- Node-specific cooking
- scheduler.executeGraph with 4 parameter combinations
- Service mode
- scheduler.startCook()
Best for: Custom scheduler configurations and service-mode execution
Method 5: Individual Node Cook
Cooks each TOP node separately with 6 methods per node.
Node priority:
- Display or render flag nodes
- Output or ROP nodes
- Regular nodes
Per-node execution sequence:
- generateStaticWorkItems
- cookWorkItems
- executeGraph
- Cook button
- Dirty then cook
- Status check
Best for: Debugging, partial execution, or when network-level cooking fails
Method 6: Dependency Chain Cook
Analyzes network topology and builds a DAG (Directed Acyclic Graph).
Execution sequence:
- Identify start nodes with no inputs
- Build dependency levels
- Cook level-by-level in topological order
Best for: Complex dependency chains where execution order mattersRetryClaude can make mistakes. Please double-check responses.
Task Options
Render Farm Script
The Render Farm Script (pdg_universal_wrapper.py) is the core execution engine that runs on each render node. This sophisticated Python script handles the entire PDG execution lifecycle on the farm.
Key responsibilities:
- Environment Setup: Creates necessary directories, sets PDG environment variables, configures paths
- HIP File Loading: Loads the Houdini scene with proper error handling and warning suppression
- TOP Network Discovery: Automatically locates and validates the specified TOP network
- Scheduler Configuration: Creates or configures the appropriate scheduler (Python, Local, or Conductor)
- Work Item Execution: Manages the cooking process based on execution mode
- Output Collection: Gathers all generated files (USD, renders, logs) and organizes them
- Status Reporting: Generates detailed JSON status reports for monitoring and debugging
The script is automatically uploaded to the render farm with each job submission and includes comprehensive error handling, fallback strategies, and detailed logging for troubleshooting.
Warning
Do not modify this script unless you fully understand its operation. Incorrect modifications will cause job failures.
Threading Section
The threading system provides comprehensive performance optimization for render farm execution, automatically configuring dozens of environment variables based on your instance type. You have complete control over these settings - choose to use the automatic configuration for convenience, modify individual settings manually, or disable the system entirely.
Use Threading
Strongly recommended to enable, especially for single machine submissions. When enabled, the system can automatically configure performance settings, but all automatic values can be overridden manually through the interface parameters. The automatic configuration:
- Detects Hardware: Parses the instance type to determine CPU cores, GPU count, and GPU type
- Optimizes Thread Counts: Sets optimal thread counts for Houdini, renderers, and all subsystems
- Configures Memory: Allocates texture, geometry, and VOP caches based on available cores
- Enables Parallelization: Configures parallel cooking, task stealing, and work distribution
- Optimizes I/O: Sets up parallel file operations, compression, and buffering
- Tunes Renderers: Configures renderer-specific settings (Karma, Mantra, Arnold, Redshift, etc.)
Control Options:
- Automatic Mode (default): Enable "Use Threading" to let the system configure all settings based on your selected instance type
- Manual Override: Disable automatic settings in specific sections (Memory, Cache, I/O, etc.) to manually configure those areas
- Custom Values: Even with automatic mode enabled, override specific values like thread counts, cache sizes, or memory limits
- Complete Manual Control: Disable "Use Threading" entirely and set all environment variables manually
Auto-Calculated Settings Include:
- PDG slots (75% of cores by default - adjustable via PDG Slots Multiplier)
- Cook batch sizes (scaled by core count - overridable with Cook Batch Override)
- Memory limits (12GB for 4 cores up to 150GB for 64+ cores - manually configurable when Auto Memory Config is disabled)
- Cache sizes (texture, geometry, expression caches - each individually overridable)
- Renderer thread counts and bucket sizes (can use Thread Override parameter)
- Network buffer sizes and timeouts (all manually adjustable)
The system displays "AUTO-CALCULATED" labels next to parameters that are automatically determined, making it clear which values are being set by the system versus manually configured.
Houdini Threaded Cook
Enables Houdini's multi-threaded cooking system. When combined with "Use Threading", this:
- Sets Cook Mode: Automatically selects between serial, parallel, hybrid, or aggressive based on cores
- 64+ cores single machine: Aggressive mode with batch size of cores × 3
- 32+ cores: Aggressive mode with batch size of cores × 2
- 16+ cores: Parallel mode with batch size equal to core count
- 8-15 cores: Hybrid mode
-
<8 cores: Automatic mode
-
Enables Advanced Features:
- Task stealing for load balancing
- Lock-free data structures
- Speculative execution
- Graph partitioning
-
Predictive scheduling
-
Memory Management: Configures memory pools, arena allocators, and slab allocators sized to core count
Use Max Processors
- User Specified Thread Count: Specify the number of threads to use for execution
- Use All Processors: Automatically set thread count to match the maximum number of processors available on the selected instance
- Use All Processors Except One: Automatically set thread count to match the maximum number of processors available minus one
Thread Count
The number of threads to use for execution. This value can be manually set when Use Max Processors is set to User Specified Thread Count. Otherwise, it is disabled and the value is set automatically.
Tip
For execution with 64+ cores, the threading system can provide significant performance improvements through optimal configuration of over 100 environment variables.
Execution Tab
The Execution tab provides comprehensive performance configuration with intelligent auto-configuration based on your selected instance type. You maintain complete control - every AUTO-CALCULATED value is a suggestion that can be overridden.
PDG & Scheduling Sub-Tab
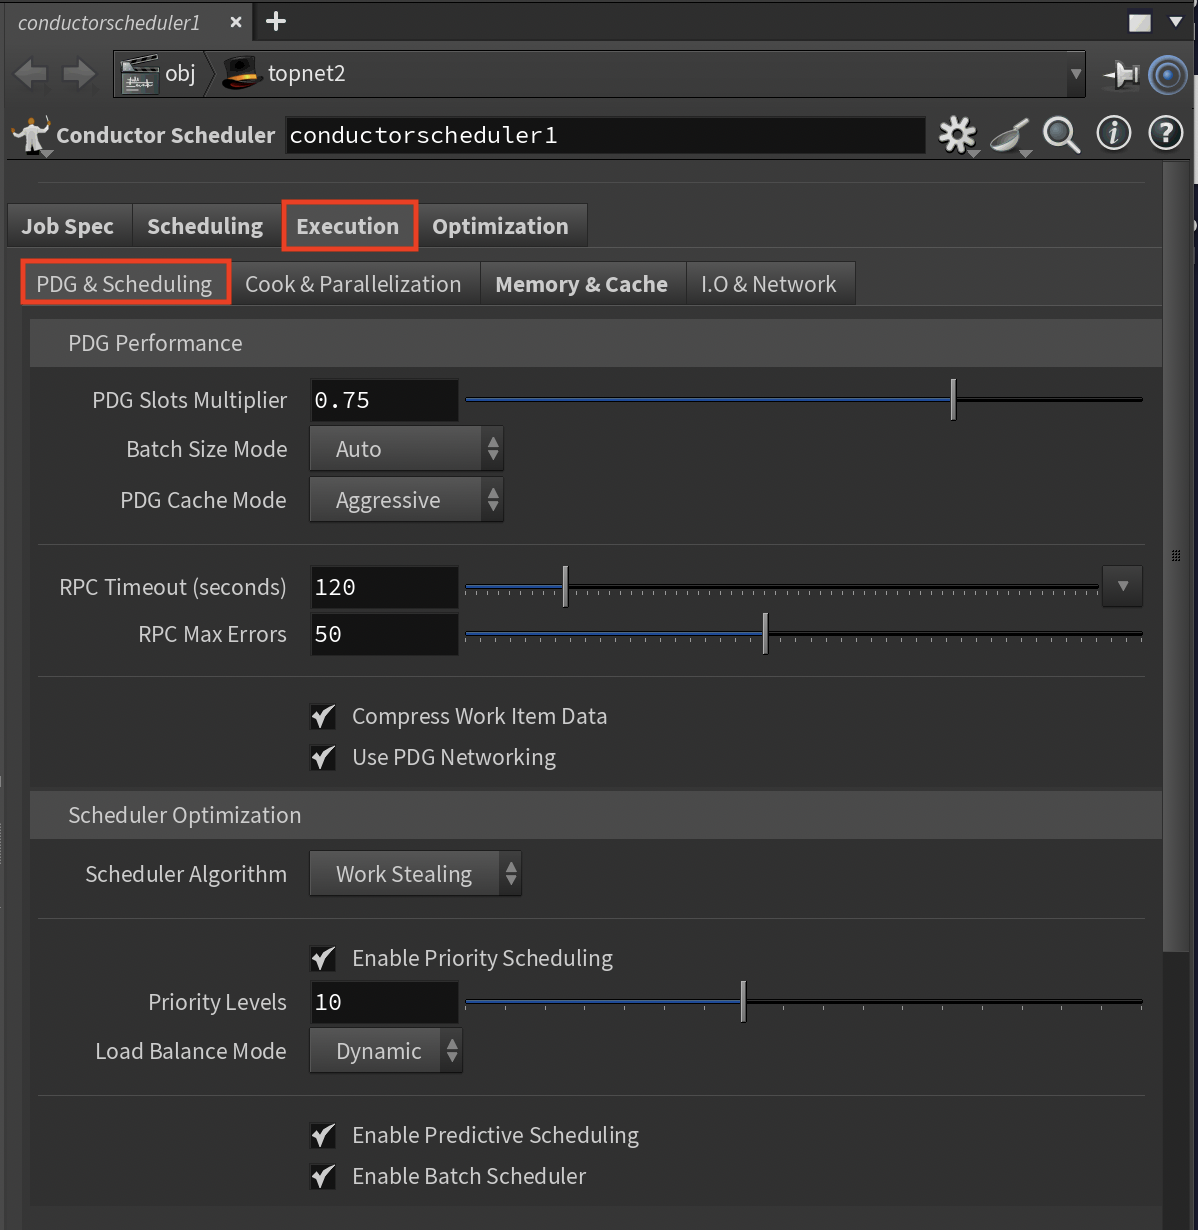
This section controls how PDG distributes and manages work items across compute resources.
PDG Performance Settings
PDG Slots Multiplier (Range: 0.1-1.0, Default: 0.75)
- Percentage of CPU cores allocated to PDG slots
- AUTO-CALCULATED: Base value determined by instance_type
- Adjust this to control resource utilization vs. overhead
- Lower values (0.5) leave headroom for other processes
- Higher values (0.9+) maximize parallelization
Batch Size Mode (Options: Auto/Conservative/Aggressive)
- Controls work item batching strategy
- AUTO-CALCULATED: Auto mode sets batch size = slots × 2
- Conservative: Smaller batches, more scheduling overhead but better for heterogeneous work
- Aggressive: Larger batches (slots × 3), less overhead but may cause imbalanced loads
- Choose based on work item characteristics
PDG Cache Mode (Options: Disabled/Conservative/Aggressive, Default: Aggressive)
- Work item data caching strategy
- Aggressive caches more data for better performance but uses more memory
- Reduce if memory is constrained or increase for better performance
RPC Timeout (Range: 30-600 seconds, Default: 120)
- Maximum wait time for work item responses
- Increase for slow networks or heavy operations
- Decrease for faster failure detection
RPC Max Errors (Range: 10-100, Default: 50)
- Failure threshold before marking work items as failed
- Control the balance between resilience and quick failure detection
Compress Work Item Data (Toggle, Default: On)
- Compresses data for network transfer
- Disable if CPU overhead is a concern
- Enable to reduce bandwidth usage (recommended for cloud)
Use PDG Networking (Toggle, Default: On)
- Enables PDG's optimized networking protocol
- Enable for large work item counts
- Disable only if experiencing compatibility issues
Scheduler Optimization Settings
Scheduler Algorithm (Options: Work Stealing/Round Robin/Priority Based/Load Balanced)
- Work item distribution algorithm
- Work Stealing (default) provides best load balancing
- Choose based on workload characteristics
Enable Priority Scheduling (Toggle, Default: On)
- Allows different priority levels for work items
- Control whether to use priority-based execution
Priority Levels (Range: 3-20, Default: 10)
- Number of distinct priority levels
- Balance granularity vs. scheduling overhead
Load Balance Mode (Options: Static/Dynamic/Adaptive)
- How work distributes across machines
- Dynamic (default) redistributes based on performance
- Select based on workload predictability
Enable Predictive Scheduling (Toggle, Default: On)
- Uses historical data for better scheduling
- Disable for unpredictable workloads
Batch Scheduler (Toggle, Default: On)
- Groups small work items into batches
- AUTO-CALCULATED: Batch size based on thread_count
- Control whether to use batching for the workflow
Cook & Parallel Sub-Tab
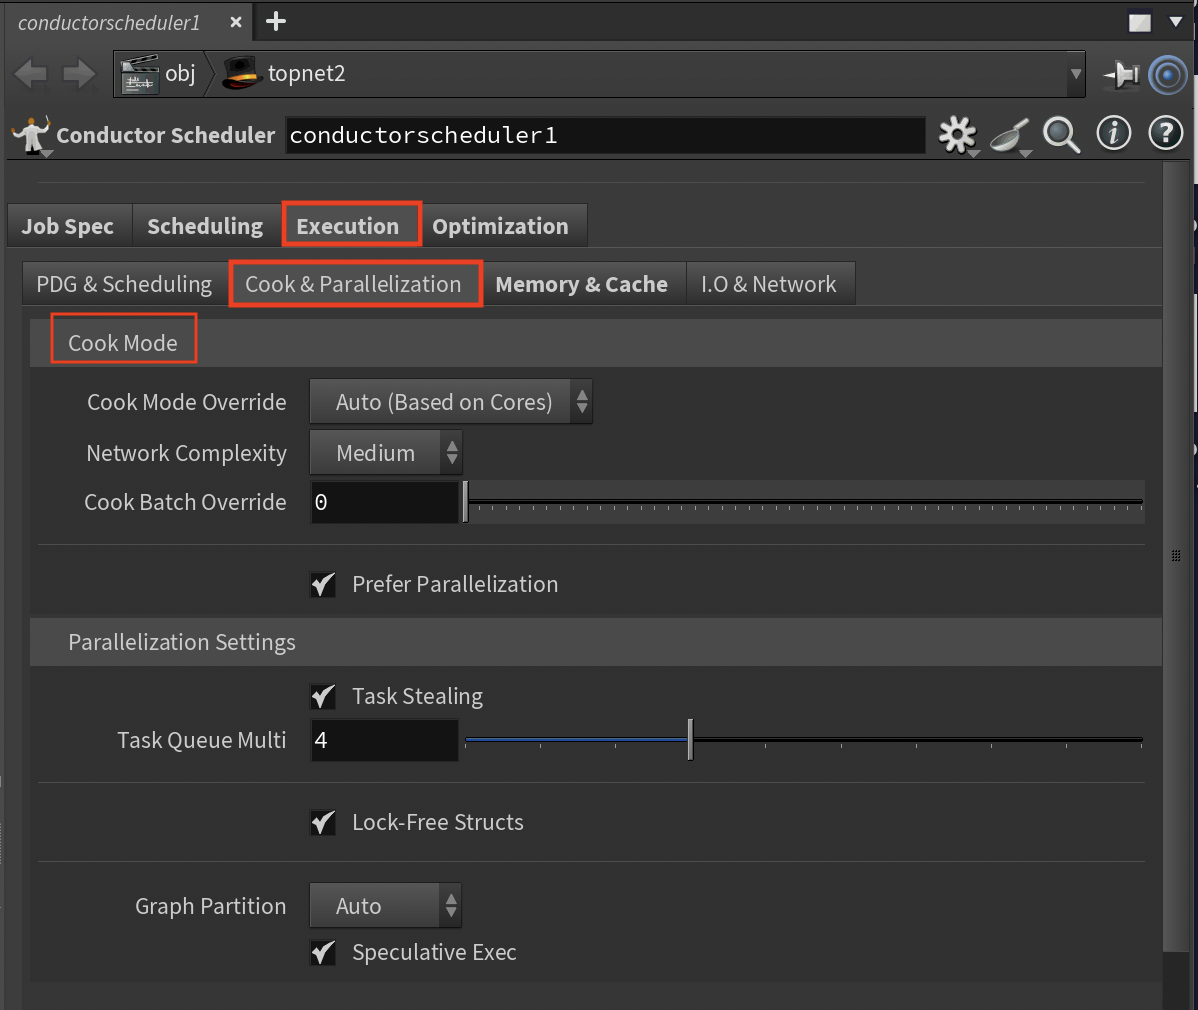
Controls Houdini's cooking system and parallelization strategies.
Cook Mode Settings
Cook Mode Override (Options: Auto/Serial/Parallel/Hybrid/Aggressive)
- AUTO-CALCULATED when set to Auto:
- Aggressive: 64+ cores single machine
- Parallel: 16-32 cores
- Hybrid: 8-15 cores
- Automatic: <8 cores
- Manually override based on network complexity
Network Complexity (Options: Simple/Medium/Complex)
- Affects parallelization aggressiveness
- Assess the network and choose accordingly
- Complex networks use more conservative parallelization
Parallel Threshold (Range: 1-100, Default: 10)
- Minimum nodes to trigger parallel cooking
- Lower for more parallelization or raise to reduce overhead
Cook Batch Override (Range: 0-500, 0=auto)
- AUTO-CALCULATED when 0:
- thread_count × 3 for 64+ cores single machine
- thread_count × 2 for 32+ cores
- thread_count for 16+ cores
- Set a specific value based on testing
Prefer Parallel (Toggle, Default: On)
- Biases toward parallel execution
- Enable for speed, disable for stability
Parallel Cooking Settings
Task Stealing (Toggle, Default: On)
- Idle threads steal work from busy threads
- Enable for better load balancing
Task Queue Multiplier (Range: 1-10, Default: 4)
- AUTO-CALCULATED: Queue size = thread_count × multiplier
- Adjust based on workload variability
Lock-Free Structures (Toggle, Default: On)
- Uses lock-free queues for better performance
- AUTO-CALCULATED: Queue size = thread_count × 100
- Disable if experiencing stability issues
Graph Partition Mode (Options: Auto/Manual/Disabled)
- AUTO-CALCULATED in Auto: Partition size = max(4, thread_count/8)
- Choose Manual to control partitioning directly
Speculative Execution (Toggle, Default: On)
- Pre-executes likely-needed nodes
- Balance performance vs. CPU usage
Memory & Cache Sub-Tab
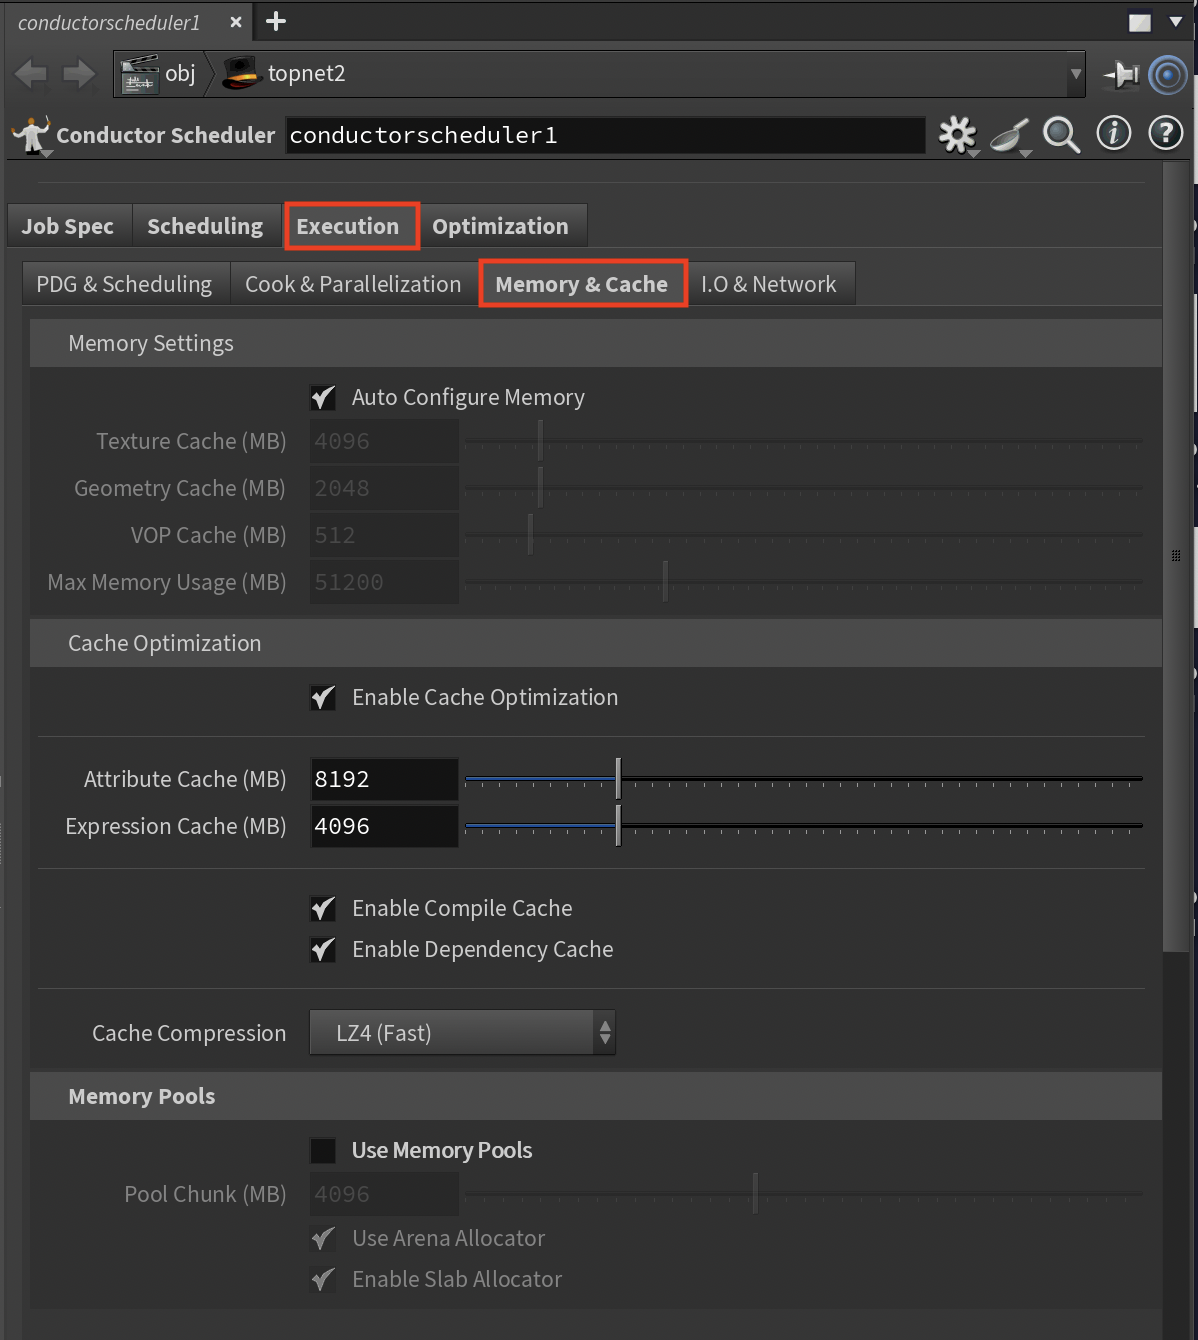
Memory management is critical for performance and stability.
Memory Settings
Auto Memory Config (Toggle, Default: On)
- When enabled, all memory values are AUTO-CALCULATED based on instance cores:
- 4 cores: 1GB texture, 512MB geometry, 12GB max
- 16 cores: 4GB texture, 2GB geometry, 50GB max
- 32 cores: 8GB texture, 4GB geometry, 100GB max
- 64+ cores: 16GB texture, 8GB geometry, 150GB max
- Disable this to manually set all memory values
Texture Cache Override (MB, Range: 512-32768)
- Only available when Auto Memory Config is disabled
- Set based on texture usage in scenes
Geometry Cache Override (MB, Range: 256-16384)
- Only available when Auto Memory Config is disabled
- Configure based on geometry complexity
VOP Cache Override (MB, Range: 128-4096)
- Only available when Auto Memory Config is disabled
- Adjust for VEX-heavy networks
Max Memory Usage (MB, Range: 8192-153600)
- Only available when Auto Memory Config is disabled
- Set the total memory limit for Houdini
Cache Optimization Settings
Enable Cache Optimization (Toggle, Default: On)
- Master switch for caching strategies
- Disable to reduce memory usage
Attrib Cache Size (MB, Range: 1024-32768, Default: 8192)
- AUTO-CALCULATED: thread_count × 128MB (capped at 8GB)
- Adjust based on attribute complexity
Expr Cache Size (MB, Range: 512-16384, Default: 4096)
- AUTO-CALCULATED: thread_count × 64MB (capped at 4GB)
- Increase for expression-heavy networks
Compile Cache (Toggle, Default: On)
- Caches compiled VEX code
- Enable for VEX-heavy workflows
Dependency Cache (Toggle, Default: On)
- Caches node dependencies
- Enable for large networks
Cache Compression (Options: None/LZ4/ZSTD/GZIP)
- LZ4 (default) balances speed and compression
- Choose based on CPU vs. storage priorities
Memory Pool Settings
Use Memory Pools (Toggle, Default: On)
- Pre-allocates memory for better performance
- Disable if memory is constrained
Pool Chunk Size (MB, Range: 1024-8192, Default: 4096)
- Size of memory pool chunks
- Balance allocation efficiency vs. waste
Arena Allocator (Toggle, Default: On)
- AUTO-CALCULATED: Arena size = thread_count × 256MB
- Enable for temporary object optimization
Slab Allocator (Toggle, Default: On)
- Optimizes fixed-size allocations
- Enable for better cache locality
I/O & Network Sub-Tab
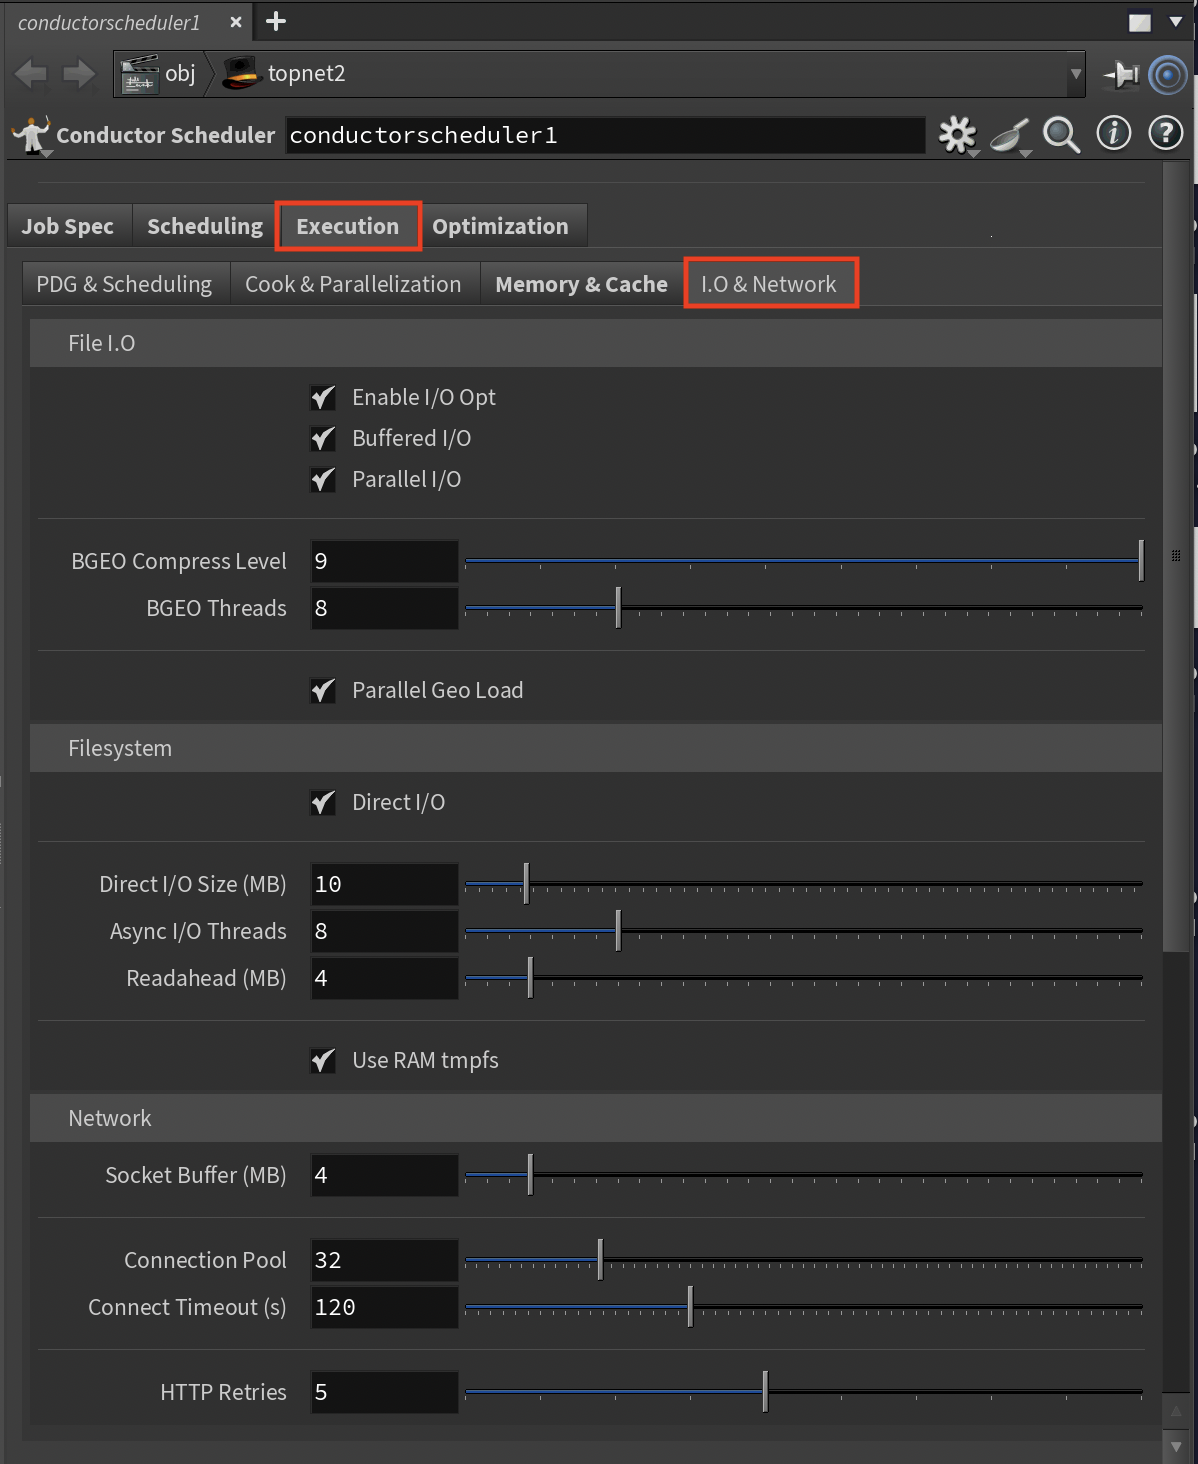
File and network operations often bottleneck PDG workflows.
File I/O Settings
Enable I/O Opt (Toggle, Default: On)
- Master switch for I/O optimizations
- Control whether to use optimized settings
Buffered I/O (Toggle, Default: On)
- Buffers file operations
- Enable for better performance, disable to reduce memory
Parallel I/O (Toggle, Default: On)
- Multi-threaded file operations
- Enable for large file handling
BGEO Compress Lvl (Range: 0-9, Default: 9)
- Compression level for geometry files
- Balance file size vs. save time
BGEO Threads (Range: 1-32, Default: 8)
- AUTO-CALCULATED: min(thread_count, 8)
- Adjust based on I/O bandwidth
Parallel Geo Load (Toggle, Default: On)
- Multi-threaded geometry loading
- Enable for scenes with many files
Filesystem Settings
Direct I/O (Toggle, Default: On)
- Bypasses OS cache for large files
- Enable to reduce memory pressure
Direct I/O Size (MB, Range: 1-100, Default: 10)
- Threshold for direct I/O
- Adjust based on typical file sizes
Async I/O (Toggle, Default: On)
- Non-blocking file operations
- Enable for better responsiveness
Async I/O Threads (Range: 1-32, Default: 8)
- Concurrent I/O operations
- Increase for heavy I/O workflows
Readahead (MB, Range: 1-32, Default: 4)
- Sequential read optimization
- Increase for streaming workflows
Use RAM tmpfs (Toggle, Default: On)
- RAM-based temporary storage
- Enable for speed, disable to save RAM
Network Settings
Socket Buffer (MB, Range: 1-32, Default: 4)
- Network buffer size
- Increase for high-latency networks
Connection Pool (Range: 8-128, Default: 32)
- Reusable network connections
- Adjust based on concurrent operations
Connect Timeout (s, Range: 30-300, Default: 120)
- Maximum connection wait time
- Increase for unreliable networks
HTTP Retries (Range: 1-10, Default: 5)
- Failed request retry attempts
- Balance resilience vs. failure detection
Optimization Tab
The Optimization tab provides advanced performance tuning for specialized workflows and hardware configurations. You have full control over these advanced settings - use automatic configuration as a starting point, then tune based on specific requirements and budget constraints.
GPU & Rendering Sub-Tab
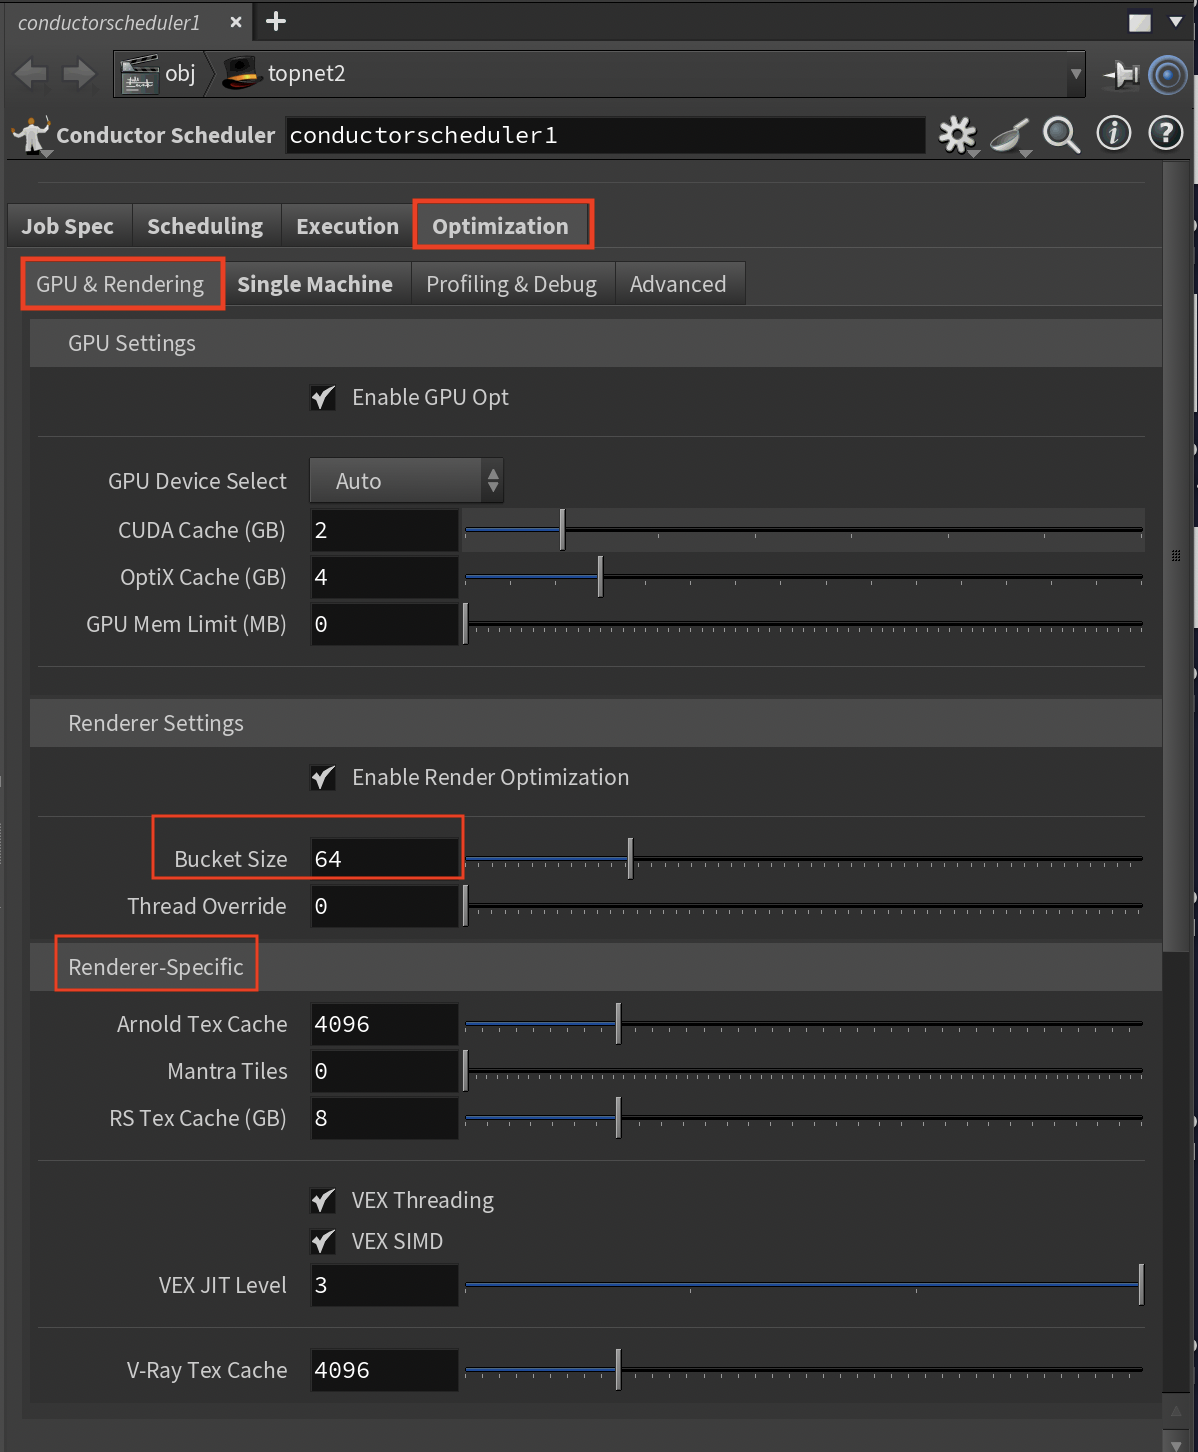
GPU and renderer-specific optimizations for maximum performance.
GPU Settings
Enable GPU Opt (Toggle, Default: On)
- AUTO-CALCULATED: Settings based on detected GPU type
- Control GPU-specific optimizations
GPU Device Select (Options: Auto/Primary Only/All Available/Manual)
- AUTO-CALCULATED: Device count from instance_type
- Choose which GPUs to use
CUDA Cache (GB, Range: 1-8, Default: 2)
- Kernel compilation cache
- Increase to reduce compilation overhead
OptiX Cache (GB, Range: 1-16, Default: 4)
- Ray tracing cache size
- Adjust for GPU ray tracing workloads
GPU Mem Limit (MB, Range: 0-48000, 0=auto)
- AUTO-CALCULATED: RTX 4000=7.5GB, RTX A6000=45GB
- Manually limit GPU memory usage if needed
Renderer Settings
Enable Render Opt (Toggle, Default: On)
- AUTO-CALCULATED: Thread counts match CPU cores
- Control renderer optimizations
VEX Threading (Toggle, Default: On)
- AUTO-CALCULATED: VEX threads = thread_count
- Enable for VEX-heavy scenes
VEX SIMD (Toggle, Default: On)
- Vector instruction optimization
- Enable for math-heavy operations
VEX JIT Level (Range: 0-3, Default: 3)
- Compilation optimization level
- Balance compile time vs. runtime speed
Bucket Size (Range: 16-256, Default: 64)
- Render tile size in pixels
- Adjust for cache efficiency
Thread Override (Range: 0-256, 0=auto)
- AUTO-CALCULATED: Uses instance thread_count when 0
- Manually set renderer threads if needed
Renderer-Specific Settings
Karma XPU Devices (Options: CPU+GPU/CPU Only/GPU Only)
- Karma rendering devices
- Choose based on available hardware
Mantra Tiles (Range: 0-64, 0=auto)
- AUTO-CALCULATED: max(4, thread_count/4)
- Adjust for memory vs. efficiency
Arnold Tex Cache (MB, Range: 512-16384, Default: 4096)
- Arnold texture cache
- Size based on texture usage
RS Tex Cache (GB, Range: 1-32, Default: 8)
- Redshift texture cache
- Configure for GPU memory
RS Prefer GPUs (Toggle, Default: On)
- GPU preference for Redshift
- Control CPU fallback behavior
V-Ray Tex Cache (MB, Range: 512-16384, Default: 4096)
- V-Ray texture cache
- Adjust for scene requirements
Single Machine Sub-Tab
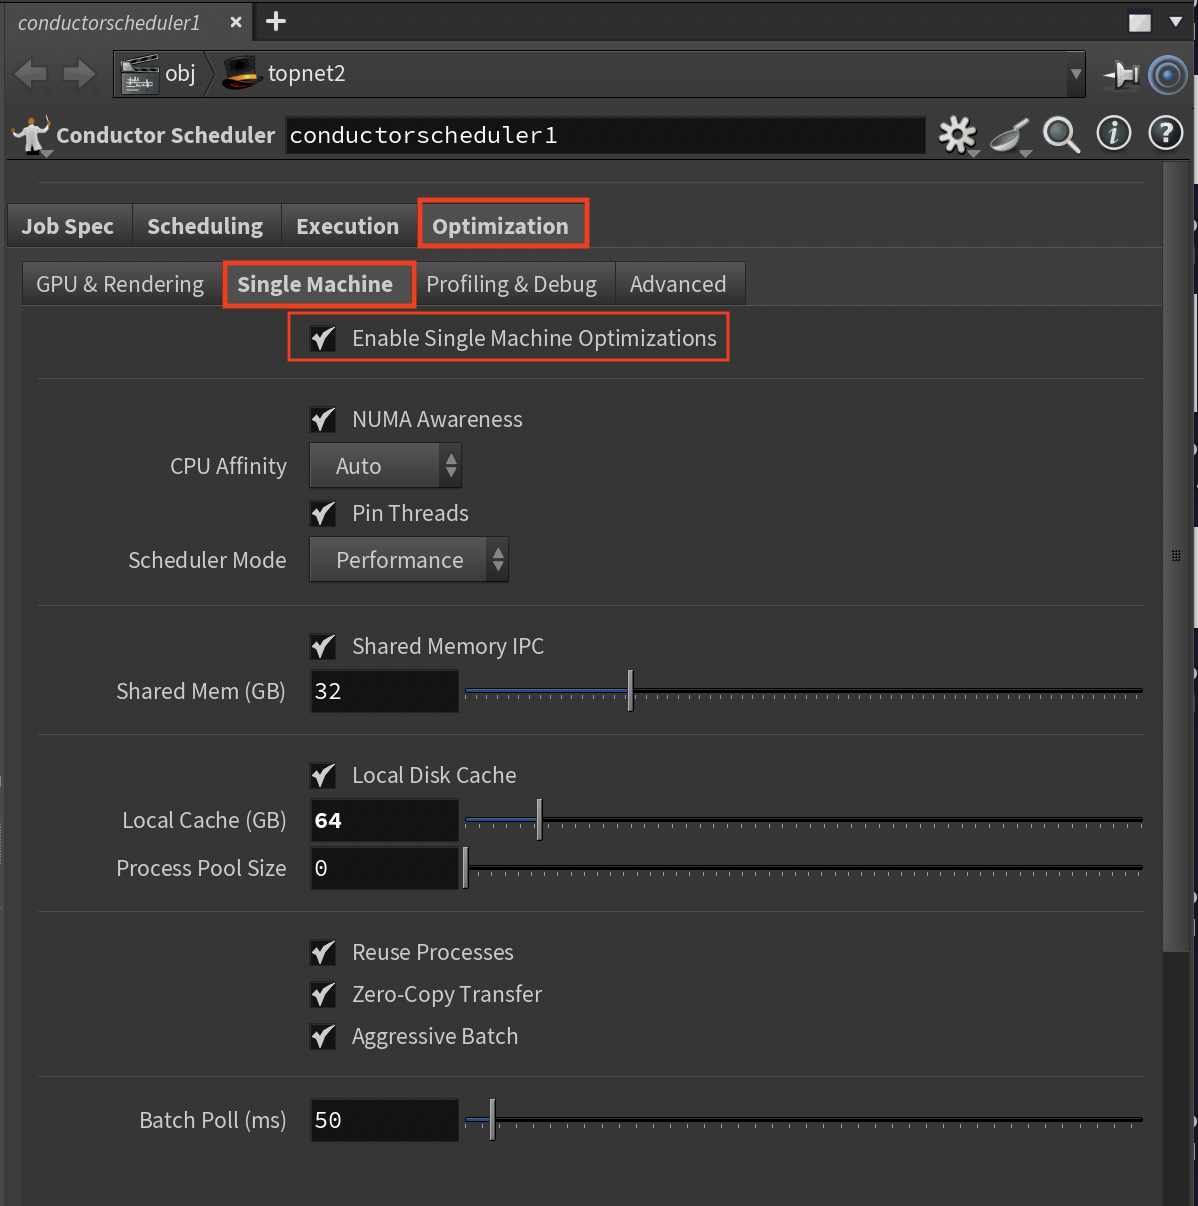
Optimizations for single high-performance machine execution.
Enable Single Opt (Toggle, Default: On)
- Activates when "Multiple Machines" is disabled
- Control single machine optimizations
NUMA Awareness (Toggle, Default: On)
- Multi-socket memory optimization
- Enable for multi-socket systems
CPU Affinity (Options: Auto/Manual/Disabled)
- Thread-to-CPU binding
- Control thread placement
Pin Threads (Toggle, Default: On)
- Reduces context switching
- Enable for consistent performance
Scheduler Mode (Options: Performance/Balanced/Power Saving)
- OS scheduler behavior
- Choose based on performance needs
Shared Memory IPC (Toggle, Default: On)
- Local inter-process communication
- Enable for faster local transfers
Shared Mem (GB, Range: 1-128, Default: 32)
- AUTO-CALCULATED: min(32GB, thread_count × 512MB)
- Size based on data sharing needs
Local Disk Cache (Toggle, Default: On)
- Local caching instead of network
- Enable for I/O intensive workflows
Local Cache (GB, Range: 10-500, Default: 100)
- AUTO-CALCULATED: min(100GB, thread_count × 1GB)
- Size based on available storage
Process Pool Size (Range: 0-256, 0=auto)
- AUTO-CALCULATED: Equals thread_count when 0
- Manually set pool size if needed
Reuse Processes (Toggle, Default: On)
- Process recycling for work items
- Enable to reduce overhead
Zero-Copy Transfer (Toggle, Default: On)
- Eliminates memory copy overhead
- Enable for large data transfers
MMap Threshold (KB, Range: 16-1024, Default: 64)
- Memory mapping threshold
- Adjust based on file sizes
Aggressive Batch (Toggle, Default: On)
- AUTO-CALCULATED: Batch size = thread_count × 10
- Enable for maximum throughput
Batch Poll (ms, Range: 10-1000, Default: 50)
- Work item check frequency
- Balance latency vs. CPU usage
Profiling & Debug Sub-Tab
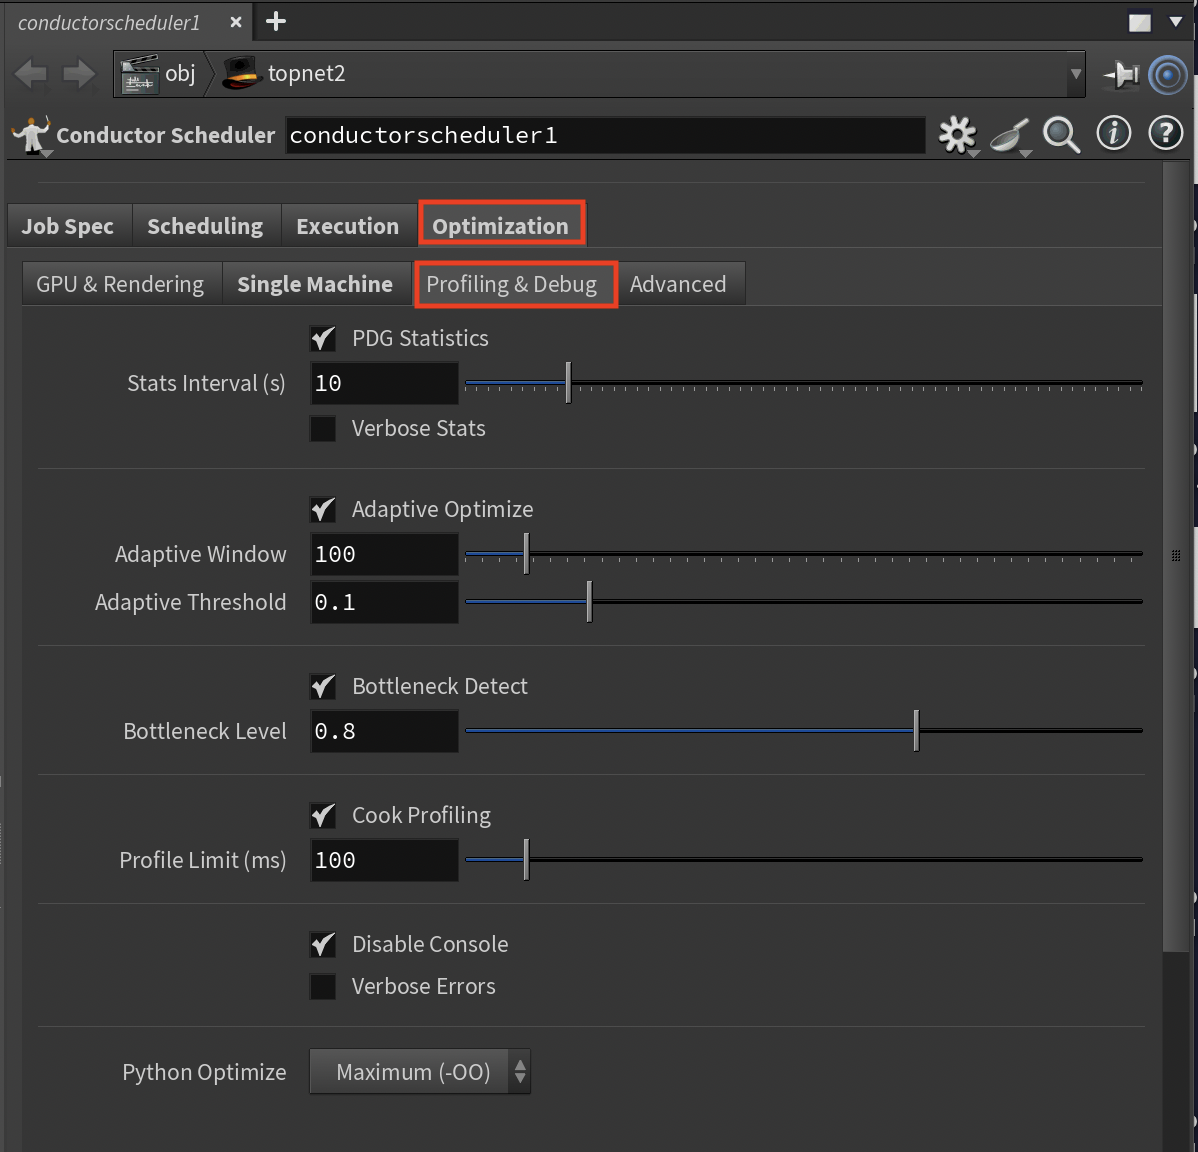
Performance monitoring and optimization tools.
PDG Statistics (Toggle, Default: On)
- Performance data collection
- Enable to identify bottlenecks
Stats Interval (s, Range: 1-60, Default: 10)
- Statistics collection frequency
- Adjust for monitoring granularity
Verbose Stats (Toggle, Default: Off)
- Detailed performance metrics
- Enable for deep analysis
Adaptive Optimize (Toggle, Default: On)
- Runtime optimization adjustments
- Enable for self-tuning performance
Adaptive Window (Range: 10-1000, Default: 100)
- Work items before adjustment
- Control adaptation frequency
Adaptive Threshold (Range: 0.01-0.5, Default: 0.1)
- Performance change trigger (10%)
- Adjust sensitivity
Bottleneck Detect (Toggle, Default: On)
- Automatic bottleneck identification
- Enable for performance analysis
Bottleneck Level (Range: 0.5-0.95, Default: 0.8)
- Time percentage for bottleneck flag (80%)
- Adjust detection sensitivity
Cook Profiling (Toggle, Default: On)
- Node cooking performance tracking
- Enable to find slow nodes
Profile Limit (ms, Range: 10-1000, Default: 100)
- Profiling threshold
- Reduce overhead with higher values
Disable Console (Toggle, Default: On)
- Suppresses console output
- Enable for better performance
Verbose Errors (Toggle, Default: Off)
- Full error stack traces
- Enable for debugging
Python Optimize (Options: None/Basic/Maximum)
- Bytecode optimization level
- Choose Maximum for best performance
Advanced Sub-Tab
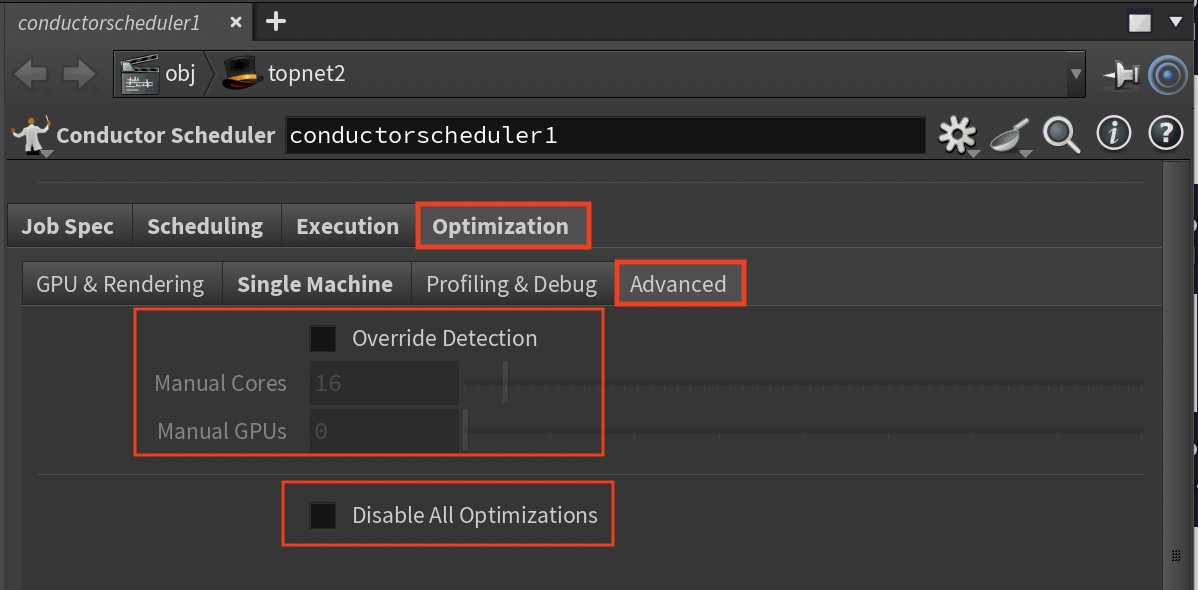
Direct control over system-level optimizations.
Compiler Flags (String, Default: "-O3 -march=native -mtune=native")
- VEX and DSO compilation flags
- Customize for target architecture
Custom Env Vars (String)
- Additional KEY=VALUE pairs (semicolon-separated)
- Add any environment variables not exposed in UI
- These override all automatic settings
Override Detection (Toggle, Default: Off)
- Manual instance type specification
- Enable when automatic detection fails
Manual Cores (Range: 1-256, Default: 16)
- Override CPU core count
- This overrides ALL thread-based AUTO-CALCULATED settings
- Set when using custom hardware
Manual GPUs (Range: 0-8, Default: 0)
- Override GPU count
- Specify exact GPU configuration
Manual GPU Type (Options: None/RTX 4000/RTX A6000/RTX 3090/RTX 4090/A100/H100)
- Override GPU type detection
- Select specific GPU model
Disable All Opt (Toggle, Default: Off)
- Emergency optimization bypass
- Use only for debugging
- This disables ALL performance optimizations
Best Practices and Cost Control
You are in complete control of all optimization settings. The AUTO-CALCULATED values are intelligent suggestions based on your selected instance type, and you have the final say on every setting.
Optimization Strategy
Start with Automatic Configuration
- Let the system configure initial values based on instance type
- Use this as a baseline for performance testing
- AUTO-CALCULATED settings provide a good starting point for most workflows
Test Before Committing
- Always use scout work items for new setups to verify correct execution
- Test with representative work items before processing entire jobs
- Verify asset uploads with "Do asset scan" in Preview tab
Monitor and Measure
- Enable PDG Statistics and Cook Profiling to identify bottlenecks
- Use the Profiling & Debug tab to understand actual performance
- Check memory usage in Preview tab to ensure settings match instance capacity
Tune for Your Specific Workflow
- Adjust settings based on measured performance, not assumptions
- Choose the right execution mode:
- Multiple machines for independent, parallel tasks
- Single machine for dependent chains or I/O-heavy workflows
- Fine-tune thread counts, cache sizes, and batch settings based on your data
Essential Checklist
- [ ] Enable threading optimizations for best performance
- [ ] Verify all required assets are detected
- [ ] Test with scout work items on new configurations
- [ ] Review memory settings against instance type limits
- [ ] Check that render output paths are correct